Software Features
Dashboards
Please note that parts of this article may only apply if you subscribe to Salestracker’s CRM functionality – some of these dashboards may be unavailable to users subscribed to the data-only version of Salestracker.
There are several dashboards available in Salestracker, and you can select which you would prefer to see. Find out how to choose your dashboard in this article.
This article aims to explain the dashboard in-depth.
Sales Dashboard
The sales dashboard is the most comprehensive dashboard in Salestracker, giving users an overview of activity. The following numbered diagram is explained by the list underneath.
![]()
- Add new record – click the link in this box to create a new private record for “My Data”.
- My notifications – click the three lines at the side to expand this box:
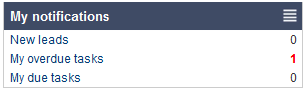
This box gives a count of new leads within the last few days, your overdue tasks and due tasks. Click the links to be taken to the leads overview page for new leads or the tasks overview page for your due/overdue tasks. - Recent activity – click the three lines at the side to expand this box:
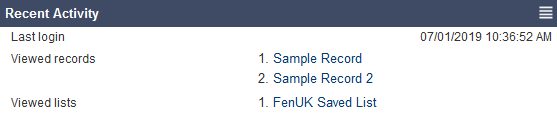
This box shows the last time you logged in, the last records you looked at and also the last lists you looked at. The latter two are links you can click on to jump to the record or the list. - My Salestracker (records) – click the three lines at the side to expand this box:

This box contains a count of the records you have access to – in the example image above, this user only has access to 186 My Data records. If you are subscribed to any of the Insight databases, the amount of records you have access to will appear here. The databases are linked – you can click on the database name to bring up that database in search. - Insight Databases (records) – click the three lines at the side to expand this box:

This box shows a count of all records available to subscribe to on the Insight databases. These figures represent a full count of what Insight Data have available and is not indicative of what you are subscribed to. - Relationships search – customers who used Salestracker Ver. 2 may recognise these filters, as they were previously called the “Sales Manager search”. You can change the filters here and click “Search” to bring up a filtered list on the relationships page.
- Relationship counts – this side of the box provides quick counts of customer relationships as they have been assigned. You can change the database filter at the top to alter the counts (assuming you are subscribed to other Insight databases) and you can click on the counts to be taken to a filtered search on the relationships page.
- Leads analysis – please read below for a detailed explanation.
Leads Analysis on the Sales Dashboard
The sales dashboard provides a snapshot of leads information, contextualised for your leads only.
![]()
- Overview – this gives you the totals for the total amount of leads, open leads, won leads and lost leads. You can click on any of the terms on the left to be taken to a filtered leads overview.
- Personal best – gives a few milestone stats – your won vs. lost percentage, and the biggest “win” you’ve achieved when completing a lead.
- Won vs. all leads – provides the conversion ratio of won to total leads. In the example above there are four leads in total and 1 has been “won”, so the ratio is one lead won in four (1:4).
- This area of the leads analysis box is reserved for various graphs to plot your leads activity, including:
- The average number of days that a lead remains open for.
- The average number of days it takes to “win” a lead.
- The pie chart representation to the won vs. lost figures (in the example above, there has been one lead won and one lead lost so it’s split 50% each).
- The bar graph represents the number of leads charted against their assigned “hotness” ranking. Please note that this section may display differently depending on whether your sales pipeline has been customised.
Manager Extras on the Sales Dashboard
If you have manager privileges, there are a few bonus extras on your sales dashboard.
Firstly, your notifications box will have a few other numbers:
![]()
You will be able to see and click on “All overdue tasks” and “All due tasks” for everyone on your subscription.
Secondly, the leads analysis box has a filter that allows you to see the stats and graphs overall as well as for any user on your subscription.
![]()
Simple Dashboard
The simple dashboard gives counts of your subscription to Salestracker:
![]()
There are also links to the last record you viewed, the last list you built and to add a new private record.
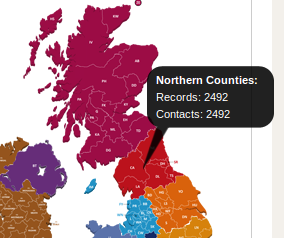
The map on the right is interactive – you can click on any region to get a total of the records Insight Data can provide for that area.
Data Dashboard
This dashboard is the default dashboard for users subscribed to the data-only version of Salestracker.
![]()
The data-only dashboard shows up to the last ten lists created on your profile. It also provides some basic statistics in the boxes on the left hand side, which are the same as in the Sales Dashboard (please see the section above for detailed information).